Data Quality Stories
Visual Data Storytelling for Trusted, Governed Data
Share trusted, traceable insights directly from your data pipelines.
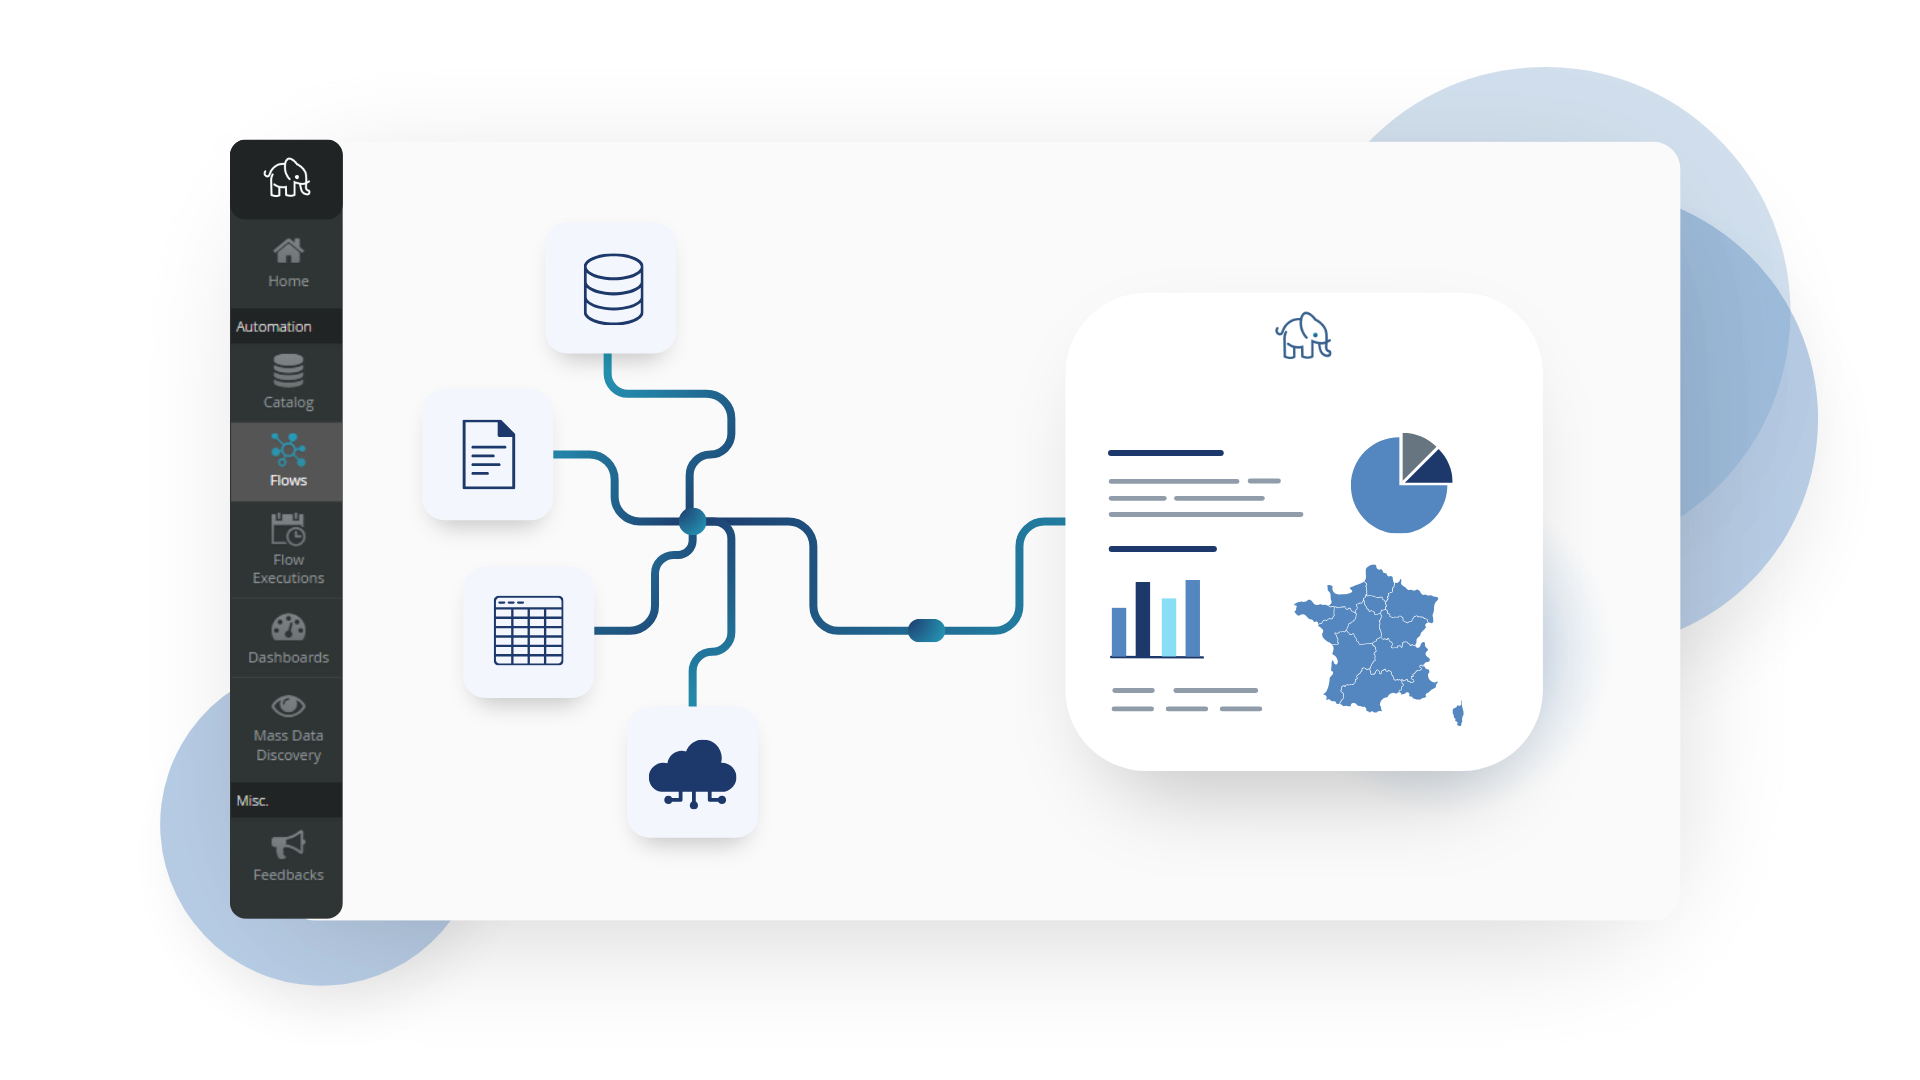
Tale of Data's Data Quality Stories feature provides a quick and flexible way to share Data Quality diagnostics across your organization. By connecting your data pipelines, quality checks and Data Products directly to shareable dashboards, you can give visibility to your data initiatives and ensure end users consume reliable, traceable data.
Each shared view is backed by Tale of Data’s validation, remediation and monitoring capabilities, helping ensure colleagues always access verified and up-to-date information. Whether you're showcasing Data Quality KPIs, compliance metrics or operational reports, Data Quality Stories creates transparent, auditable views of your data assets.
With Data Quality Stories, sharing insights becomes simple: teams can visualize and distribute the results of their pipelines and Data Quality controls in one governed environment, ensuring everyone works with current, trusted information.

Key features of our Data Quality Stories module
Empower stakeholders to make faster decisions with dashboards powered by trusted, controlled and traceable data. Tale of Data combines visualization, KPIs, lineage and business context in one environment.
Data visualisation
Instantly transform raw data into powerful visuals for quicker understanding and impact. Bring meaning to your metrics through intuitive visual representation.
Dashboards
Build interactive, reliable dashboards in minutes with an intuitive no-code interface. Easily connect them to your data pipelines for insights.
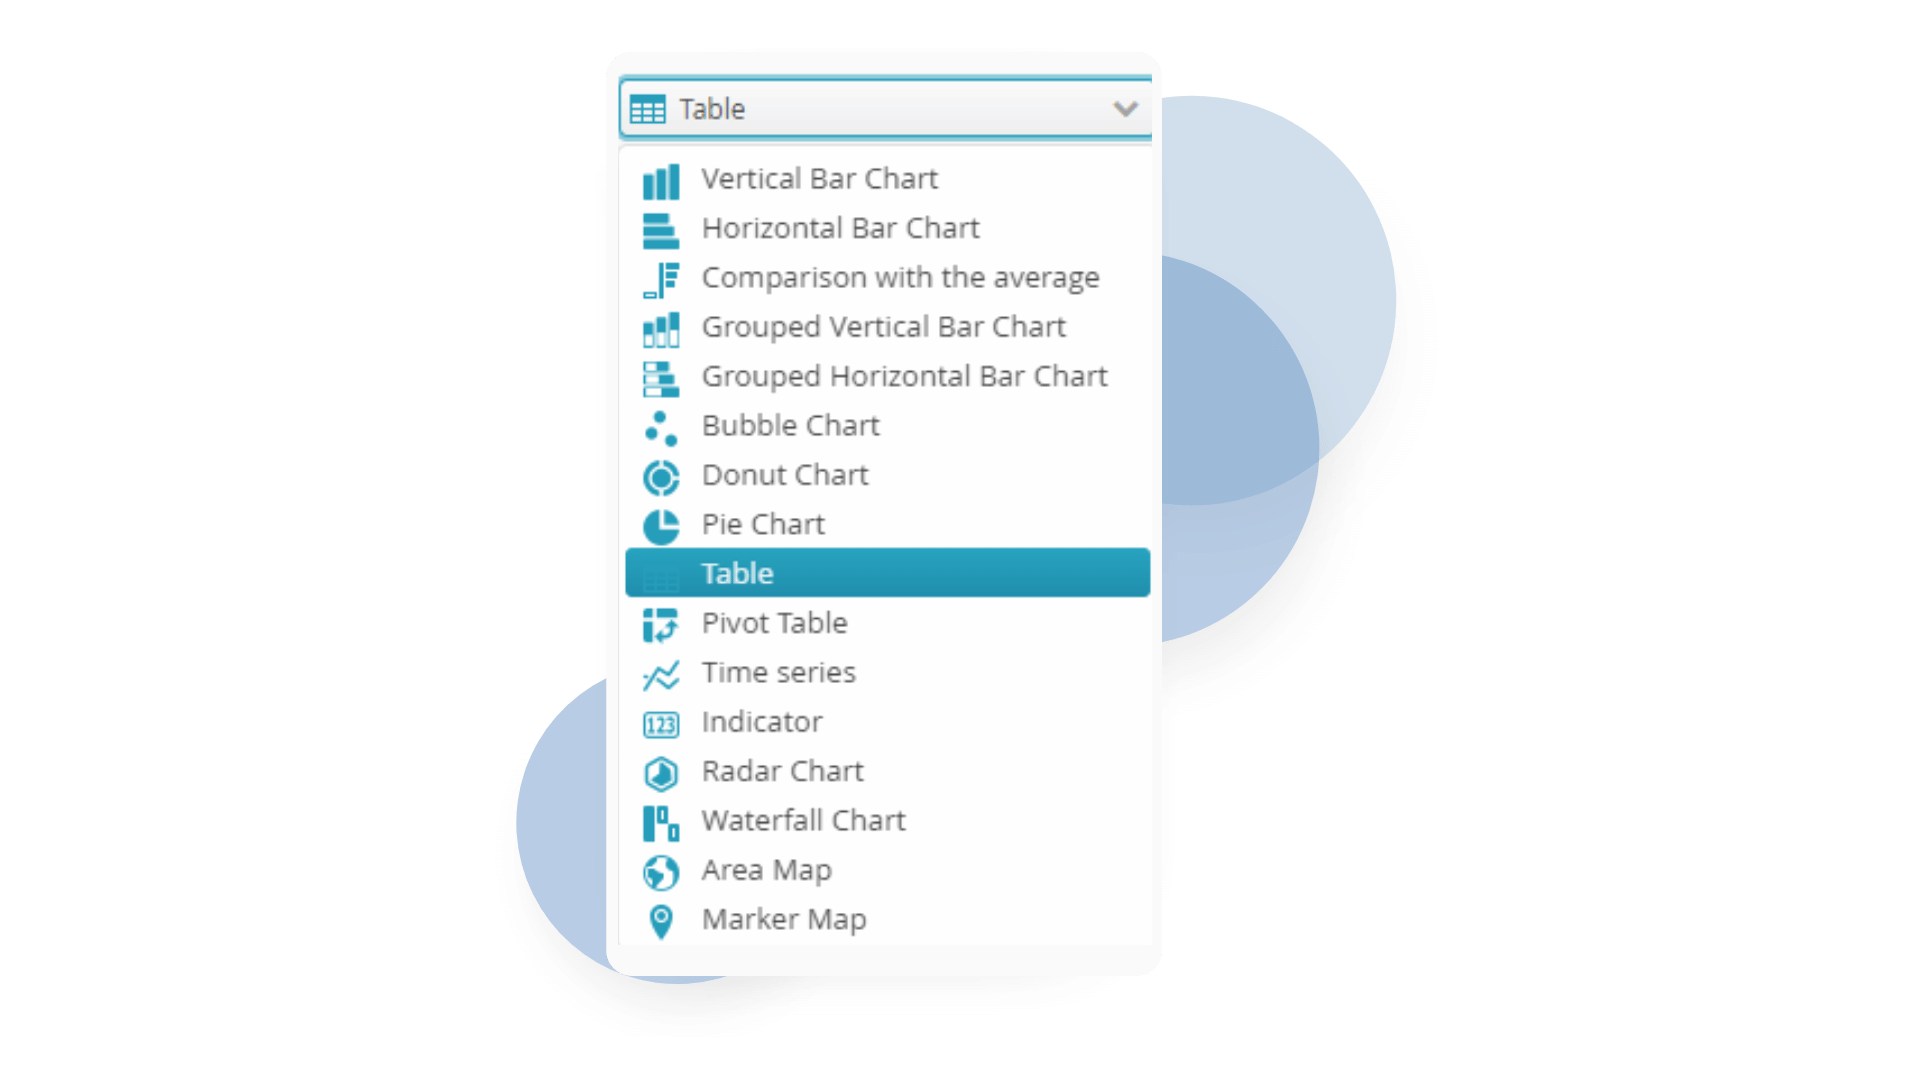
15+ Chart types
Choose from over 15 customizable chart types to adapt your dashboards to every audience and storytelling scenario.
Access Control
Control access with precision: decide who sees what and when. Publish certified dashboards internally or externally with just a few clicks.
Easy Downloads
Easily download tailored versions of your dashboards in one click—no more wasting time exchanging massive Excel files by email. Share the right view, with the right people, instantly.
Historical Comparison
Instantly benchmark your data against historical trends or averages to highlight outliers, gaps, or abnormal behavior.
Filtering
Enable advanced user-defined filters to zoom into specific areas of interest. Make every dashboard relevant to its viewer.
Pivot tables
Summarize and explore data using advanced pivot tables with unlimited grouping options and flexible formatting. Specialist presets are available for financial data and specific colouring requirements.
Split charts
Automatically break down charts by key categories for deeper comparison. Visual exploration that used to take hours is now instant.
Product Benefits
Integrate
Seamless integration of AI and No-Code technology for effective data refinement.
Collaboration
Shareable
Visualize
Powerful
Quality
Achieve superior data quality faster and at a lower cost, while demonstrating the tangible value of investing in data excellence.
Intuition
Organized
Aligned
Don't just take our word for it
Read what our customers say about us.
Ready to turn trusted data into insights your teams can rely on?
Visualize and share outputs from your data pipelines, quality controls and Data Products through trusted, traceable dashboards.